$ cd terraform
$ terraform init

Initializing the backend...
Initializing provider plugins...
- Finding sacloud/sakuracloud versions matching "2.26.0"...
- Installing sacloud/sakuracloud v2.26.0...
- Installed sacloud/sakuracloud v2.26.0 (self-signed, key ID 96CEB4B93D86849D)
Partner and community providers are signed by their developers.
If you'd like to know more about provider signing, you can read about it here:

...

Terraform has been successfully initialized!

You may now begin working with Terraform. Try running "terraform plan" to see
any changes that are required for your infrastructure. All Terraform commands
should now work.

If you ever set or change modules or backend configuration for Terraform,
rerun this command to reinitialize your working directory. If you forget, other
commands will detect it and remind you to do so if necessary.
ちゃんと動いてそうですかね
つぎにterraform.tfvarsを設定して, terraform validateします。
$ terraform validate
Success! The configuration is valid.
そして実際にterraformを実行してサーバを立ち上げていきます。
まずはplanを実行、16個のリソースを作成すると出ていれば良いとのこと
$ terraform plan

data.sakuracloud_archive.ubuntu: Reading...
data.sakuracloud_archive.ubuntu: Read complete after 2s [id=113701786671]

Terraform used the selected providers to generate the following execution plan. Resource actions are indicated
with the following symbols:
  + create

Terraform will perform the following actions:

  # sakuracloud_disk.monitor_server will be created
  + resource "sakuracloud_disk" "monitor_server" {
      + connector            = "virtio"
      + encryption_algorithm = "none"
      + id                   = (known after apply)
      + name                 = "tidbcluster-monitor-disk"
      + plan                 = "ssd"
      + server_id            = (known after apply)
      + size                 = 40
      + source_archive_id    = "113701786671"
      + zone                 = (known after apply)
    }

...

  # sakuracloud_switch.private_sw will be created
  + resource "sakuracloud_switch" "private_sw" {
      + description = "Private network switch"
      + id          = (known after apply)
      + name        = "tidbcluster-sw"
      + server_ids  = (known after apply)
      + zone        = (known after apply)
    }


Plan: 14 to add, 0 to change, 0 to destroy.

Changes to Outputs:
  + vpcrouter_public_ip = (known after apply)

─────────────────────────────────────────────────────────────────────────────────────────────────────────────────

Note: You didn't use the -out option to save this plan, so Terraform can't guarantee to take exactly these
actions if you run "terraform apply" now.
$ terraform state list
data.sakuracloud_archive.ubuntu
sakuracloud_disk.monitor_server
sakuracloud_disk.tidb_bastion
sakuracloud_disk.tidb_server[0]
sakuracloud_disk.tikv_server[0]
sakuracloud_disk.tikv_server[1]
sakuracloud_disk.tikv_server[2]
sakuracloud_server.monitor_server
sakuracloud_server.tidb_bastion
sakuracloud_server.tidb_server[0]
sakuracloud_server.tikv_server[0]
sakuracloud_server.tikv_server[1]
sakuracloud_server.tikv_server[2]
sakuracloud_switch.private_sw
sakuracloud_vpc_router.vpcrouter
planで差分を比較しておく
$ terraform plan
data.sakuracloud_archive.ubuntu: Reading...
sakuracloud_switch.private_sw: Refreshing state... [id=113702095119]
data.sakuracloud_archive.ubuntu: Read complete after 1s [id=113701786671]
sakuracloud_disk.tidb_bastion: Refreshing state... [id=113702095122]
sakuracloud_disk.monitor_server: Refreshing state... [id=113702095124]
sakuracloud_disk.tidb_server[0]: Refreshing state... [id=113702095125]
sakuracloud_disk.tikv_server[2]: Refreshing state... [id=113702095120]
sakuracloud_disk.tikv_server[0]: Refreshing state... [id=113702095123]
sakuracloud_disk.tikv_server[1]: Refreshing state... [id=113702095121]
sakuracloud_vpc_router.vpcrouter: Refreshing state... [id=113702095126]
sakuracloud_server.tidb_bastion: Refreshing state... [id=113702095138]
sakuracloud_server.tidb_server[0]: Refreshing state... [id=113702095145]
sakuracloud_server.monitor_server: Refreshing state... [id=113702095140]
sakuracloud_server.tikv_server[0]: Refreshing state... [id=113702095143]
sakuracloud_server.tikv_server[2]: Refreshing state... [id=113702095144]
sakuracloud_server.tikv_server[1]: Refreshing state... [id=113702095142]

No changes. Your infrastructure matches the configuration.

Terraform has compared your real infrastructure against your configuration and found no differences, so no
changes are needed.
うーむ、差分はなさそうに見えるしこれでいいのかな、、
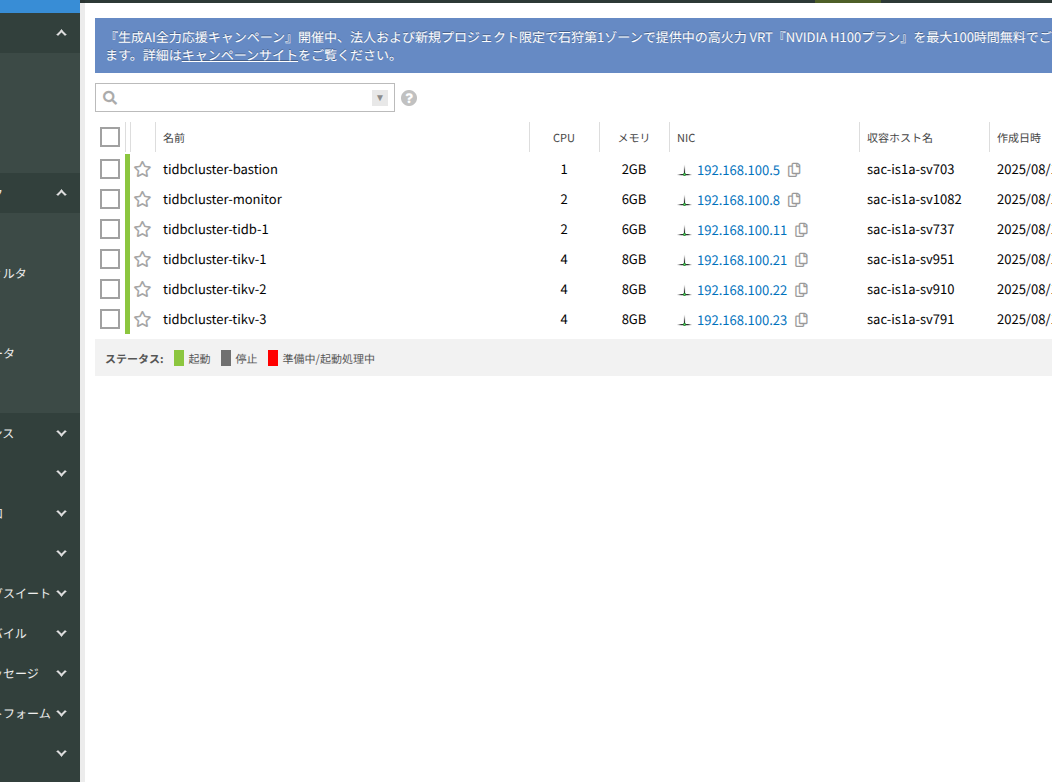
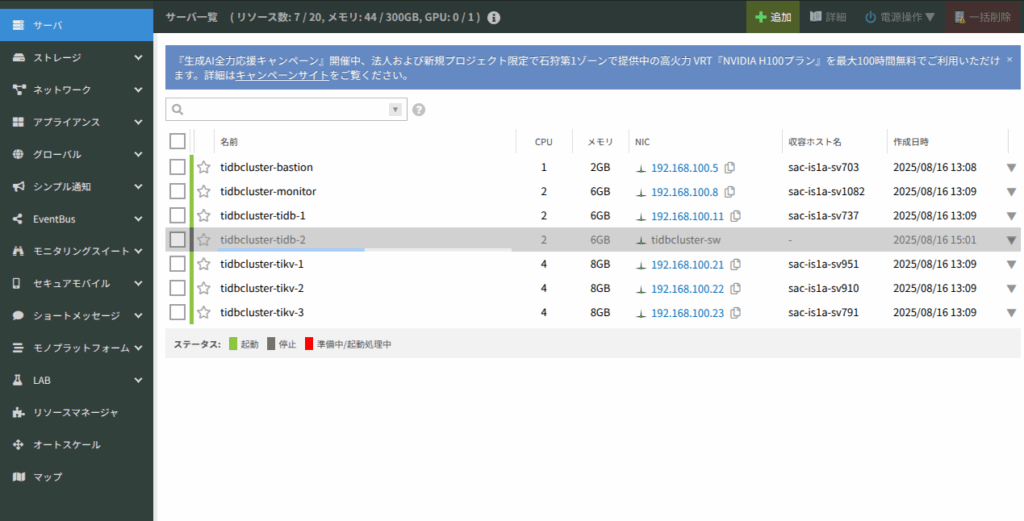
logに出てきたIPで作成されたサーバにsshログインします。
$ ssh -i ~/.ssh/sakura_cloud ubuntu@133.242.68.108

Welcome to Ubuntu 24.04.2 LTS (GNU/Linux 6.8.0-62-generic x86_64)
...

To run a command as administrator (user "root"), use "sudo <command>".
See "man sudo_root" for details.

ubuntu@tidbcluster-bastion:~$
$ ansible cluster -i inventory.ini -m ping

[WARNING]: Platform linux on host 192.168.100.22 is using the discovered Python interpreter at
/usr/bin/python3.12, but future installation of another Python interpreter could change the meaning of that path.
See https://docs.ansible.com/ansible-core/2.18/reference_appendices/interpreter_discovery.html for more
information.
192.168.100.22 | SUCCESS => {
    "ansible_facts": {
        "discovered_interpreter_python": "/usr/bin/python3.12"
    },
    "changed": false,
    "ping": "pong"
}
[WARNING]: Platform linux on host 192.168.100.11 is using the discovered Python interpreter at
/usr/bin/python3.12, but future installation of another Python interpreter could change the meaning of that path.
See https://docs.ansible.com/ansible-core/2.18/reference_appendices/interpreter_discovery.html for more
information.
192.168.100.11 | SUCCESS => {
    "ansible_facts": {
        "discovered_interpreter_python": "/usr/bin/python3.12"
    },
    "changed": false,
    "ping": "pong"
}
[WARNING]: Platform linux on host 192.168.100.21 is using the discovered Python interpreter at
/usr/bin/python3.12, but future installation of another Python interpreter could change the meaning of that path.
See https://docs.ansible.com/ansible-core/2.18/reference_appendices/interpreter_discovery.html for more
information.
192.168.100.21 | SUCCESS => {
    "ansible_facts": {
        "discovered_interpreter_python": "/usr/bin/python3.12"
    },
    "changed": false,
    "ping": "pong"
}
[WARNING]: Platform linux on host 192.168.100.23 is using the discovered Python interpreter at
/usr/bin/python3.12, but future installation of another Python interpreter could change the meaning of that path.
See https://docs.ansible.com/ansible-core/2.18/reference_appendices/interpreter_discovery.html for more
information.
192.168.100.23 | SUCCESS => {
    "ansible_facts": {
        "discovered_interpreter_python": "/usr/bin/python3.12"
    },
    "changed": false,
    "ping": "pong"
}
[WARNING]: Platform linux on host 192.168.100.8 is using the discovered Python interpreter at
/usr/bin/python3.12, but future installation of another Python interpreter could change the meaning of that path.
See https://docs.ansible.com/ansible-core/2.18/reference_appendices/interpreter_discovery.html for more
information.
192.168.100.8 | SUCCESS => {
    "ansible_facts": {
        "discovered_interpreter_python": "/usr/bin/python3.12"
    },
    "changed": false,
    "ping": "pong"
}
192.168.100.12 | UNREACHABLE! => {
    "changed": false,
    "msg": "Failed to connect to the host via ssh: ssh: connect to host 192.168.100.12 port 22: No route to host",
    "unreachable": true
}
$ ansible-playbook -i inventory.ini bastion_playbook.yml --ask-become-pass
BECOME password:
PLAY [Install necessary packages on bastion host] ****************************************************************
TASK [Gathering Facts] *******************************************************************************************
[WARNING]: Platform linux on host localhost is using the discovered Python interpreter at /usr/bin/python3.12,
but future installation of another Python interpreter could change the meaning of that path. See
$ ansible-playbook -i inventory.ini cluster_playbook.yml --ask-become-pass
ubuntu@tidbcluster-bastion:~/ansible$ ansible-playbook -i inventory.ini cluster_playbook.yml --ask-become-pass
BECOME password:
PLAY [Install necessary packages on bastion host] ****************************************************************
TASK [Gathering Facts] *******************************************************************************************
[WARNING]: Platform linux on host localhost is using the discovered Python interpreter at /usr/bin/python3.12,
but future installation of another Python interpreter could change the meaning of that path. See
$ tiup cluster check ./topology.yaml --user ubuntu -i ~/.ssh/sakura_cloud

+ Detect CPU Arch Name
  - Detecting node 192.168.100.11 Arch info ... Error
  - Detecting node 192.168.100.21 Arch info ... Error
  - Detecting node 192.168.100.22 Arch info ... Error
  - Detecting node 192.168.100.23 Arch info ... Error
  - Detecting node 192.168.100.8 Arch info ... Error

Error: failed to fetch cpu-arch or kernel-name: executor.ssh.execute_failed: Failed to execute command over SSH for 'ubuntu@192.168.100.23:22' {ssh_stderr: sudo: a terminal is required to read the password; either use the -S option to read from standard input or configure an askpass helper
sudo: a password is required
, ssh_stdout: , ssh_command: export LANG=C; PATH=$PATH:/bin:/sbin:/usr/bin:/usr/sbin; /usr/bin/sudo -H bash -c "uname -m"}, cause: Process exited with status 1

Verbose debug logs has been written to /home/ubuntu/.tiup/logs/tiup-cluster-debug-2025-08-16-15-27-50.log.
ubuntu@tidbcluster-bastion:~/ansible$ ansible-playbook -i inventory.ini cluster_playbook.yml --ask-become-pass
BECOME password:

PLAY [Configure passwordless sudo for ubuntu user] ***************************************************************

TASK [Gathering Facts] *******************************************************************************************
[WARNING]: Platform linux on host 192.168.100.22 is using the discovered Python interpreter at
/usr/bin/python3.12, but future installation of another Python interpreter could change the meaning of that path.
See https://docs.ansible.com/ansible-core/2.18/reference_appendices/interpreter_discovery.html for more
information.
ok: [192.168.100.22]
[WARNING]: Platform linux on host 192.168.100.11 is using the discovered Python interpreter at
/usr/bin/python3.12, but future installation of another Python interpreter could change the meaning of that path.
See https://docs.ansible.com/ansible-core/2.18/reference_appendices/interpreter_discovery.html for more
information.
ok: [192.168.100.11]
[WARNING]: Platform linux on host 192.168.100.23 is using the discovered Python interpreter at
/usr/bin/python3.12, but future installation of another Python interpreter could change the meaning of that path.
See https://docs.ansible.com/ansible-core/2.18/reference_appendices/interpreter_discovery.html for more
information.
ok: [192.168.100.23]
[WARNING]: Platform linux on host 192.168.100.21 is using the discovered Python interpreter at
/usr/bin/python3.12, but future installation of another Python interpreter could change the meaning of that path.
See https://docs.ansible.com/ansible-core/2.18/reference_appendices/interpreter_discovery.html for more
information.
ok: [192.168.100.21]
[WARNING]: Platform linux on host 192.168.100.12 is using the discovered Python interpreter at
/usr/bin/python3.12, but future installation of another Python interpreter could change the meaning of that path.
See https://docs.ansible.com/ansible-core/2.18/reference_appendices/interpreter_discovery.html for more
information.
ok: [192.168.100.12]
[WARNING]: Platform linux on host 192.168.100.8 is using the discovered Python interpreter at
/usr/bin/python3.12, but future installation of another Python interpreter could change the meaning of that path.
See https://docs.ansible.com/ansible-core/2.18/reference_appendices/interpreter_discovery.html for more
information.
ok: [192.168.100.8]

TASK [Add ubuntu user to sudoers with NOPASSWD] ******************************************************************
changed: [192.168.100.11]
changed: [192.168.100.23]
changed: [192.168.100.22]
changed: [192.168.100.21]
changed: [192.168.100.12]
changed: [192.168.100.8]

PLAY RECAP *******************************************************************************************************
192.168.100.11             : ok=2    changed=1    unreachable=0    failed=0    skipped=0    rescued=0    ignored=0
192.168.100.12             : ok=2    changed=1    unreachable=0    failed=0    skipped=0    rescued=0    ignored=0
192.168.100.21             : ok=2    changed=1    unreachable=0    failed=0    skipped=0    rescued=0    ignored=0
192.168.100.22             : ok=2    changed=1    unreachable=0    failed=0    skipped=0    rescued=0    ignored=0
192.168.100.23             : ok=2    changed=1    unreachable=0    failed=0    skipped=0    rescued=0    ignored=0
192.168.100.8              : ok=2    changed=1    unreachable=0    failed=0    skipped=0    rescued=0    ignored=0
もう一度tiupを実行します.
なんだかfailとか色々出ていますがデプロイには支障がないそうなので、次へ進みます
ubuntu@tidbcluster-bastion:~$ tiup cluster check ./topology.yaml --user ubuntu -i ~/.ssh/sakura_cloud


+ Detect CPU Arch Name
  - Detecting node 192.168.100.11 Arch info ... Done
  - Detecting node 192.168.100.21 Arch info ... Done
  - Detecting node 192.168.100.22 Arch info ... Done
  - Detecting node 192.168.100.23 Arch info ... Done
  - Detecting node 192.168.100.8 Arch info ... Done


+ Detect CPU OS Name
  - Detecting node 192.168.100.11 OS info ... Done
  - Detecting node 192.168.100.21 OS info ... Done
  - Detecting node 192.168.100.22 OS info ... Done
  - Detecting node 192.168.100.23 OS info ... Done
  - Detecting node 192.168.100.8 OS info ... Done
+ Download necessary tools
  - Downloading check tools for linux/amd64 ... Done
+ Collect basic system information
+ Collect basic system information
  - Getting system info of 192.168.100.11:22 ... ⠧ CopyComponent: component=insight, version=, remote=192.168.1...
  - Getting system info of 192.168.100.21:22 ... ⠧ CopyComponent: component=insight, version=, remote=192.168.1...
+ Collect basic system information
+ Collect basic system information
  - Getting system info of 192.168.100.11:22 ... Done
  - Getting system info of 192.168.100.21:22 ... Done
  - Getting system info of 192.168.100.22:22 ... Done
  - Getting system info of 192.168.100.23:22 ... Done
  - Getting system info of 192.168.100.8:22 ... Done
+ Check time zone
  - Checking node 192.168.100.21 ... Done
  - Checking node 192.168.100.22 ... Done
  - Checking node 192.168.100.23 ... Done
  - Checking node 192.168.100.8 ... Done
  - Checking node 192.168.100.11 ... Done
+ Check system requirements
+ Check system requirements
+ Check system requirements
+ Check system requirements
+ Check system requirements
+ Check system requirements
  - Checking node 192.168.100.11 ... Done
  - Checking node 192.168.100.21 ... Done
+ Check system requirements
+ Check system requirements
+ Check system requirements
  - Checking node 192.168.100.11 ... Done
+ Check system requirements
+ Check system requirements
+ Check system requirements
+ Check system requirements
  - Checking node 192.168.100.11 ... Done
  - Checking node 192.168.100.21 ... Done
  - Checking node 192.168.100.22 ... Done
  - Checking node 192.168.100.23 ... Done
  - Checking node 192.168.100.11 ... Done
  - Checking node 192.168.100.8 ... Done
  - Checking node 192.168.100.8 ... Done
  - Checking node 192.168.100.8 ... Done
  - Checking node 192.168.100.21 ... Done
  - Checking node 192.168.100.22 ... Done
  - Checking node 192.168.100.23 ... Done
  - Checking node 192.168.100.8 ... Done
  - Checking node 192.168.100.11 ... Done
+ Cleanup check files
  - Cleanup check files on 192.168.100.11:22 ... Done
  - Cleanup check files on 192.168.100.21:22 ... Done
  - Cleanup check files on 192.168.100.22:22 ... Done
  - Cleanup check files on 192.168.100.23:22 ... Done
  - Cleanup check files on 192.168.100.8:22 ... Done
Node            Check         Result  Message
----            -----         ------  -------
192.168.100.11  thp           Fail    THP is enabled, please disable it for best performance
192.168.100.11  command       Pass    numactl: policy: default
192.168.100.11  cpu-cores     Pass    number of CPU cores / threads: 2
192.168.100.11  cpu-governor  Warn    Unable to determine current CPU frequency governor policy
192.168.100.11  disk          Warn    mount point / does not have 'noatime' option set
192.168.100.11  service       Pass    service firewalld not found, ignore
192.168.100.11  limits        Fail    soft limit of 'nofile' for user 'tidb' is not set or too low
192.168.100.11  limits        Fail    hard limit of 'nofile' for user 'tidb' is not set or too low
192.168.100.11  limits        Fail    soft limit of 'stack' for user 'tidb' is not set or too low
192.168.100.11  sysctl        Fail    vm.swappiness = 60, should be 0
192.168.100.11  sysctl        Fail    net.core.somaxconn = 4096, should 32768 or greater
192.168.100.11  sysctl        Fail    net.ipv4.tcp_syncookies = 1, should be 0
192.168.100.11  selinux       Pass    SELinux is disabled
192.168.100.11  service       Fail    service irqbalance not found, should be installed and started
192.168.100.11  os-version    Warn    OS is Ubuntu 24.04.2 LTS 24.04.2 (Ubuntu support is not fully tested, be careful)
192.168.100.11  memory        Pass    memory size is 6144MB
192.168.100.11  disk          Fail    mount point / does not have 'nodelalloc' option set
192.168.100.21  disk          Fail    mount point / does not have 'nodelalloc' option set
192.168.100.21  command       Pass    numactl: policy: default
192.168.100.21  limits        Fail    soft limit of 'nofile' for user 'tidb' is not set or too low
192.168.100.21  limits        Fail    hard limit of 'nofile' for user 'tidb' is not set or too low
192.168.100.21  limits        Fail    soft limit of 'stack' for user 'tidb' is not set or too low
192.168.100.21  sysctl        Fail    net.core.somaxconn = 4096, should 32768 or greater
192.168.100.21  sysctl        Fail    net.ipv4.tcp_syncookies = 1, should be 0
192.168.100.21  sysctl        Fail    vm.swappiness = 60, should be 0
192.168.100.21  service       Fail    service irqbalance not found, should be installed and started
192.168.100.21  os-version    Warn    OS is Ubuntu 24.04.2 LTS 24.04.2 (Ubuntu support is not fully tested, be careful)
192.168.100.21  cpu-cores     Pass    number of CPU cores / threads: 4
192.168.100.21  cpu-governor  Warn    Unable to determine current CPU frequency governor policy
192.168.100.21  memory        Pass    memory size is 8192MB
192.168.100.21  disk          Warn    mount point / does not have 'noatime' option set
192.168.100.21  selinux       Pass    SELinux is disabled
192.168.100.21  thp           Fail    THP is enabled, please disable it for best performance
192.168.100.21  service       Pass    service firewalld not found, ignore
192.168.100.21  timezone      Pass    time zone is the same as the first PD machine: Asia/Tokyo
192.168.100.22  service       Fail    service irqbalance not found, should be installed and started
192.168.100.22  thp           Fail    THP is enabled, please disable it for best performance
192.168.100.22  service       Pass    service firewalld not found, ignore
192.168.100.22  timezone      Pass    time zone is the same as the first PD machine: Asia/Tokyo
192.168.100.22  cpu-governor  Warn    Unable to determine current CPU frequency governor policy
192.168.100.22  memory        Pass    memory size is 8192MB
192.168.100.22  sysctl        Fail    net.core.somaxconn = 4096, should 32768 or greater
192.168.100.22  sysctl        Fail    net.ipv4.tcp_syncookies = 1, should be 0
192.168.100.22  sysctl        Fail    vm.swappiness = 60, should be 0
192.168.100.22  selinux       Pass    SELinux is disabled
192.168.100.22  cpu-cores     Pass    number of CPU cores / threads: 4
192.168.100.22  disk          Fail    mount point / does not have 'nodelalloc' option set
192.168.100.22  disk          Warn    mount point / does not have 'noatime' option set
192.168.100.22  limits        Fail    soft limit of 'nofile' for user 'tidb' is not set or too low
192.168.100.22  limits        Fail    hard limit of 'nofile' for user 'tidb' is not set or too low
192.168.100.22  limits        Fail    soft limit of 'stack' for user 'tidb' is not set or too low
192.168.100.22  command       Pass    numactl: policy: default
192.168.100.22  os-version    Warn    OS is Ubuntu 24.04.2 LTS 24.04.2 (Ubuntu support is not fully tested, be careful)
192.168.100.23  timezone      Pass    time zone is the same as the first PD machine: Asia/Tokyo
192.168.100.23  memory        Pass    memory size is 8192MB
192.168.100.23  disk          Warn    mount point / does not have 'noatime' option set
192.168.100.23  service       Fail    service irqbalance not found, should be installed and started
192.168.100.23  service       Pass    service firewalld not found, ignore
192.168.100.23  cpu-cores     Pass    number of CPU cores / threads: 4
192.168.100.23  cpu-governor  Warn    Unable to determine current CPU frequency governor policy
192.168.100.23  selinux       Pass    SELinux is disabled
192.168.100.23  os-version    Warn    OS is Ubuntu 24.04.2 LTS 24.04.2 (Ubuntu support is not fully tested, be careful)
192.168.100.23  thp           Fail    THP is enabled, please disable it for best performance
192.168.100.23  command       Pass    numactl: policy: default
192.168.100.23  disk          Fail    mount point / does not have 'nodelalloc' option set
192.168.100.23  limits        Fail    soft limit of 'nofile' for user 'tidb' is not set or too low
192.168.100.23  limits        Fail    hard limit of 'nofile' for user 'tidb' is not set or too low
192.168.100.23  limits        Fail    soft limit of 'stack' for user 'tidb' is not set or too low
192.168.100.23  sysctl        Fail    net.core.somaxconn = 4096, should 32768 or greater
192.168.100.23  sysctl        Fail    net.ipv4.tcp_syncookies = 1, should be 0
192.168.100.23  sysctl        Fail    vm.swappiness = 60, should be 0
192.168.100.8   memory        Pass    memory size is 6144MB
192.168.100.8   disk          Fail    mount point / does not have 'nodelalloc' option set
192.168.100.8   selinux       Pass    SELinux is disabled
192.168.100.8   timezone      Pass    time zone is the same as the first PD machine: Asia/Tokyo
192.168.100.8   cpu-governor  Warn    Unable to determine current CPU frequency governor policy
192.168.100.8   disk          Warn    mount point / does not have 'noatime' option set
192.168.100.8   limits        Fail    soft limit of 'stack' for user 'tidb' is not set or too low
192.168.100.8   limits        Fail    soft limit of 'nofile' for user 'tidb' is not set or too low
192.168.100.8   limits        Fail    hard limit of 'nofile' for user 'tidb' is not set or too low
192.168.100.8   thp           Fail    THP is enabled, please disable it for best performance
192.168.100.8   service       Fail    service irqbalance not found, should be installed and started
192.168.100.8   command       Pass    numactl: policy: default
192.168.100.8   cpu-cores     Pass    number of CPU cores / threads: 2
192.168.100.8   sysctl        Fail    net.core.somaxconn = 4096, should 32768 or greater
192.168.100.8   sysctl        Fail    net.ipv4.tcp_syncookies = 1, should be 0
192.168.100.8   sysctl        Fail    vm.swappiness = 60, should be 0
192.168.100.8   service       Pass    service firewalld not found, ignore
192.168.100.8   os-version    Warn    OS is Ubuntu 24.04.2 LTS 24.04.2 (Ubuntu support is not fully tested, be careful)
以下のコマンドで簡易な問題は修正できるらしいので実行
$ tiup cluster check --apply ./topology.yaml --user ubuntu -i ~/.ssh/sakura_cloud

...

192.168.100.11  sysctl        Fail    will try to set 'net.core.somaxconn = 32768'
192.168.100.11  sysctl        Fail    will try to set 'net.ipv4.tcp_syncookies = 0'
192.168.100.11  sysctl        Fail    will try to set 'vm.swappiness = 0'
192.168.100.11  thp           Fail    will try to disable THP, please check again after reboot
+ Try to apply changes to fix failed checks
  - Applying changes on 192.168.100.21 ... ⠼ Sysctl: host=192.168.100.21 vm.swappiness = 0
+ Try to apply changes to fix failed checks
  - Applying changes on 192.168.100.21 ... ⠴ Sysctl: host=192.168.100.21 vm.swappiness = 0
  - Applying changes on 192.168.100.22 ... ⠴ Sysctl: host=192.168.100.22 vm.swappiness = 0
  - Applying changes on 192.168.100.23 ... ⠴ Shell: host=192.168.100.23, sudo=true, command=`if [ -d /sys/kerne...
  - Applying changes on 192.168.100.8 ... ⠴ Sysctl: host=192.168.100.8 vm.swappiness = 0
  - Applying changes on 192.168.100.11 ... ⠴ Sysctl: host=192.168.100.11 vm.swappiness = 0
Run command on 192.168.100.22(sudo:true): if [ -d /sys/kernel/mm/transparent_hugepage ]; then echo never > /sys/kernel/mm/transparent_hugepage/enabled; fi
+ Try to apply changes to fix failed checks
  - Applying changes on 192.168.100.21 ... Done
  - Applying changes on 192.168.100.22 ... Done
  - Applying changes on 192.168.100.23 ... Done
  - Applying changes on 192.168.100.8 ... Done
  - Applying changes on 192.168.100.11 ... Done
それではデプロイしていきます
$ tiup cluster deploy tidb-test v8.1.1 ./topology.yaml --user ubuntu -i ~/.ssh/sakura_cloud

...

Cluster `tidb-test` deployed successfully, you can start it with command: `tiup cluster start tidb-test --init`
deploy成功していそうですね!
それではクラスターを起動していきましょう〜
$ tiup cluster start tidb-test --init
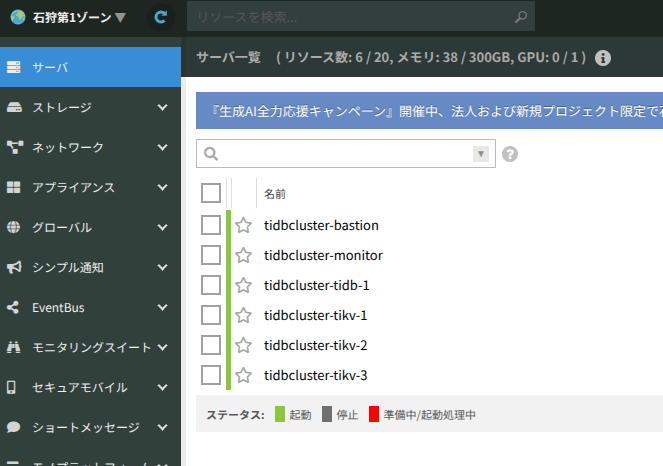
ちゃんとサーバーが立ち上がっていそうですね
$ tiup cluster display tidb-test
Cluster type:       tidb
Cluster name:       tidb-test
Cluster version:    v8.1.1
Deploy user:        tidb
SSH type:           builtin
Dashboard URL:      http://192.168.100.11:2379/dashboard
Dashboard URLs:     http://192.168.100.11:2379/dashboard
Grafana URL:        http://192.168.100.8:3000
ID                    Role          Host            Ports        OS/Arch       Status   Data Dir                      Deploy Dir
--                    ----          ----            -----        -------       ------   --------                      ----------
192.168.100.8:9093    alertmanager  192.168.100.8   9093/9094    linux/x86_64  Up       /tidb-data/alertmanager-9093  /tidb-deploy/alertmanager-9093
192.168.100.8:3000    grafana       192.168.100.8   3000         linux/x86_64  Up       -                             /tidb-deploy/grafana-3000
192.168.100.11:2379   pd            192.168.100.11  2379/2380    linux/x86_64  Up|L|UI  /tidb-data/pd-2379            /tidb-deploy/pd-2379
192.168.100.8:9090    prometheus    192.168.100.8   9090/12020   linux/x86_64  Up       /tidb-data/prometheus-9090    /tidb-deploy/prometheus-9090
192.168.100.11:4000   tidb          192.168.100.11  4000/10080   linux/x86_64  Up       -                             /tidb-deploy/tidb-4000
192.168.100.21:20160  tikv          192.168.100.21  20160/20180  linux/x86_64  Up       /tidb-data/tikv-20160         /tidb-deploy/tikv-20160
192.168.100.22:20160  tikv          192.168.100.22  20160/20180  linux/x86_64  Up       /tidb-data/tikv-20160         /tidb-deploy/tikv-20160
192.168.100.23:20160  tikv          192.168.100.23  20160/20180  linux/x86_64  Up       /tidb-data/tikv-20160         /tidb-deploy/tikv-20160
Total nodes: 8
mysqlクライアントで接続していきます
ubuntu@tidbcluster-bastion:~$ mysql -h  192.168.100.11 -P 4000 -u root -p
Enter password:
Welcome to the MySQL monitor.  Commands end with ; or \g.
Your MySQL connection id is 3384803334
Server version: 8.0.11-TiDB-v8.1.1 TiDB Server (Apache License 2.0) Community Edition, MySQL 8.0 compatible

Copyright (c) 2000, 2025, Oracle and/or its affiliates.

Oracle is a registered trademark of Oracle Corporation and/or its
affiliates. Other names may be trademarks of their respective
owners.

Type 'help;' or '\h' for help. Type '\c' to clear the current input statement.

mysql>
クエリも実行できますね
mysql> select version();
+--------------------+
| version()          |
+--------------------+
| 8.0.11-TiDB-v8.1.1 |
+--------------------+
1 row in set (0.00 sec)


 docs.ansible.com for more information.
ok: [localhost]
TASK [Download and install TiUP] *********************************************************************************
changed: [localhost]
TASK [Install MySQL client] **************************************************************************************
changed: [localhost]
PLAY RECAP *******************************************************************************************************
localhost : ok=3 changed=2 unreachable=0 failed=0 skipped=0 rescued=0 ignored=0
docs.ansible.com for more information.
ok: [localhost]
TASK [Download and install TiUP] *********************************************************************************
changed: [localhost]
TASK [Install MySQL client] **************************************************************************************
changed: [localhost]
PLAY RECAP *******************************************************************************************************
localhost : ok=3 changed=2 unreachable=0 failed=0 skipped=0 rescued=0 ignored=0